what are we able to get out from the data
Tip: the highlighted links below take you to the Data page and highlight the exact row being discussed.
What affects the calories
One of the clear patterns is that the high calorie foods also tend to have very high fat. For example, Burger King's Whopper with Cheese has the highest calorie count at 760 calories and also the highest total fat at 47g. The Sonic Burger with Mustard follows with 640 calories and 37g fat.
However, protein does not increase at the same rate. The Whopper with Cheese has 33g protein, while Chick-fil-A’s Spicy Deluxe actually has slightly more protein at 34g, despite having only 540 calories and 25g fat.
This suggests that there might be some correlation between fat and calories while not between calories and protein. In this dataset, high calories do not necessarily mean that the customer receives proportionally more protein or nutritional value.
is there a correlation between price and the amount of trans fat
Trans fat has mostly been phased out of fast food, but not completely. In order to find if there is an correlation between the price of the food and the amount of trans fat in each item, we can generate a dot-plot graph.
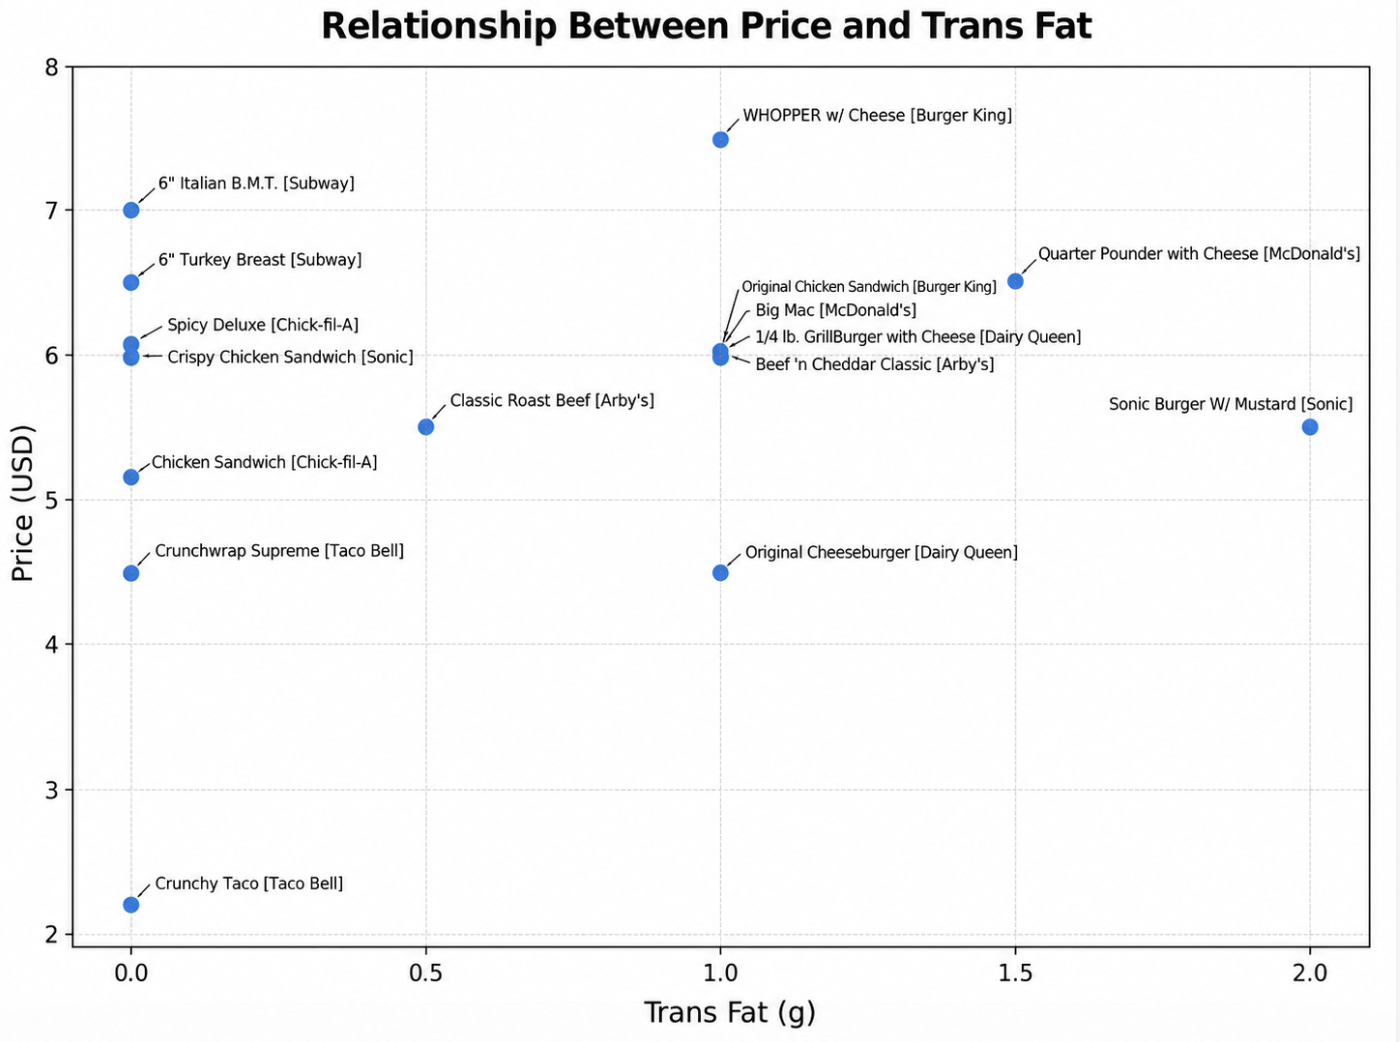
A similar pattern appears among products containing 0 g of trans fat. Their prices vary dramatically. Taco Bell’s Crunchy Taco has 0 g of trans fat and costs only $2.19, while Subway’s 6” Italian B.M.T., which also has 0 g, costs $6.99. This shows that having little or no trans fat does not necessarily make an item cheaper.